Welcome to CC Bay Desal
This page is dedicated to sharing informational resources on desalination in the Corpus Christi Bay. If you have any questions or comments please send us a message at ccbaydesal@gmail.com.
Petition: Do you want the City of Corpus Christi to do far field modeling for their desalination facilities? Click here to let them know and to help protect our bays.
PROTECT THE CORPUS CHRISTI BAY: A demand for better science on desalination
August 10th, 2024: Quick overview of the CCBay Model from the Port of Corpus Christi Authority
In the fall of 2023, LRE Water completed a far field model for the Corpus Christi Bay area. The purpose of the model was to simulate how desalination from different proposed plants would affect water quality in the Corpus Christi Bay system. While it is a good start, we believe the model needs significant improvements and validation before the results should be considered reliable. At the moment, we believe the model is underpredicting the increase in salinity from desalination and overpredicting how fast the mixing is near the desalination outfalls, which is why we are advocating for the City of Corpus Christi to take a more proactive role in modeling the impacts from desalination.
Before reading any further, be sure to check out this write up from the model’s author about the CCBay Model. It includes an in depth description of the inputs used for the model, an overview of the results for the Port’s La Quinta desalination plant, and further modeling recommendations.
Desalination Brine Discharge Modeling – Corpus Christi Bay System EFDC+ Modeling Report
At this point you may be wondering why all of this modeling would be necessary, and that’s a good question. The importance of modeling the mixing and transport of desalination wastewater is to ensure that the ecosystem won’t be negatively affected in a significant way. The Coastal Bend has a unique and rich ecosystem that deserves to be protected. We fish here, we recreate here, and our tourism and hospitality industries depend on having a healthy bay. Unfortunately, due to reduced freshwater inflows, droughts, high rates of evaporation, and various wastewater discharges, the health of the bay is at risk. Desalination in the bay has the potential to increase the salinity and reduce dissolved oxygen levels in different parts of the bay, resulting in higher stress on aquatic life and a higher likelihood of hypoxia or dead zones in the Corpus Christi Bay. For more info, check out these reports:
Development of a “dead zone” from the proposed Inner Harbor desalination outfall
Vulnerability Assessment of Coastal Bend Bays
So far the City of Corpus Christi has only modeled the first 400 feet of mixing and transport for their proposed desalination plants, Inner Harbor and La Quinta. We believe the City can do better, and need to do better before building their $757 million Inner Harbor desalination plant. Why would you spend that much money on a large scale, high output facility without first looking at the potential impacts? It just doesn’t make sense. At a City Council meeting in June of 2024, Drew Molly, the Chief Operating Officer for CC Water, and his team stated that they believe the modeling they have done is sufficient and they will not be doing any far field modeling. This is concerning because far field modeling is a standard practice when developing desalination plants. Most desal plants are out in the ocean or an open bay where desal waste can be quickly dispersed. However, the Corpus Christi Bay is a sheltered bay system with very little mixing compared to most, if not all, other seawater reverse osmosis facilities. Therefore adequate modeling is even more important for a body of water like the Corpus Christi Bay and its surrounding water bodies.
Okay, so back to the CCBay Model. There are a number of potential issues with the way this model is setup, we’ll cover that at a later date. Instead, we want to focus on just one issue, the distribution of brine coming out of the desalination plants’ outfalls and how that will impact the results from the CCBay Model.
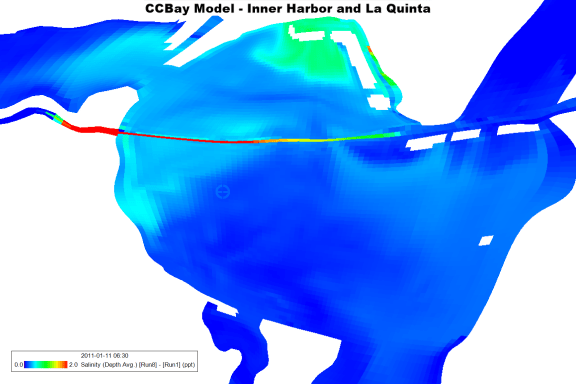
The distribution of desal wastewater for all of the desal plants in the CCBay Model are set up to be uniformly mixed throughout the water column from top to bottom. In most situations this would be ideal, however the mixing energy in the Corpus Christi Bay, especially the Inner Harbor segment, is not strong enough to mix desal brine as efficiently. This can be seen on page 48 of the City’s 2021 Technical Memorandum (Figure 20). The heavy brine from desalination sinks as it travels from the plant’s outfall and occupies less than 1/3 of the water column. We believe this means the brine will start out much more concentrated while also occupying a smaller volume of water, making mixing slower and less efficient as it travels away from the outfall structure. Slower mixing also means the brine will take longer to dissipate, resulting in higher salinities than the model is predicting. And that’s concerning because the increases in salinity the model is showing are already not that great. Click on the link below if you want to view the results from the CCBay Model. Just keep in mind when viewing this video that what you’re seeing is unmodified and straight from the Port’s model and that correcting the vertical distribution of brine from the plant’s outfall will likely result in higher increases in salinity and slower dissipation of brine.
CCBay Model – Inner Harbor and La Quinta Salinity Increase 2010 to 2011
The animation was generated by creating a salinity difference layer between Run 8 and Run 1 (Run 8 minus Run 1) and playing the results from 2010 to 2011. In theory, this should cancel out every discharge except for the City’s Inner Harbor and La Quinta plants since those are the only differences between the two models. The salinity difference layer was color mapped to show zero difference as dark blue and a 2 ppt difference as red. To be fair, the red parts do go over 2 ppt, but we chose to cap it here so that it would be easier to see the variations in between 0 and 2 ppt.
What’s so important about 2 ppt? This is a common salinity limit used for desalination facilities in order to ensure that operations are protective of the environment. The Texas Parks and Wildlife Department recommended using this limit in its 2018 Marine Seawater Desalination Diversion and Discharge Zones Study. Technically, the limit is for anything beyond 100 meters from the plant’s outfall. The grids in the CCBay Model are around 200 meters by 300 meters, so any cell that isn’t the desalination outfall cell that is red, indicates a possible violation of this limit. If you don’t have the time to check out the video, I’ll tell you right now, there are a lot of red cells.
So what’s the solution? It depends on who you ask. For us, we want to know the facts, using the best available science, and let people decide for themselves. Since the current results are concerning, and could be much worse, we think the best way to resolve this issue would be for the City of Corpus Christi to do far field modeling for its Inner Harbor and La Quinta plants, using accurate inputs, validify the results, share them with the public in a open and transparent way, and allow public input to make sure something doesn’t get overlooked. If you agree, be sure to sign our petition and let your local leaders know that the Corpus Christi Bay deserves to be protected.
August 18th, 2024: Modeling files update
The Port of Corpus Christi Authority has posted a form on their website to download the modeling files for the CCBay model. The whole set is around 1TB. You can view the files using a demo version of EFDC+ which can be found on the EE Modeling System Website.
